 (2500 x 183 px) (1)")
Padua Facilities
Overview
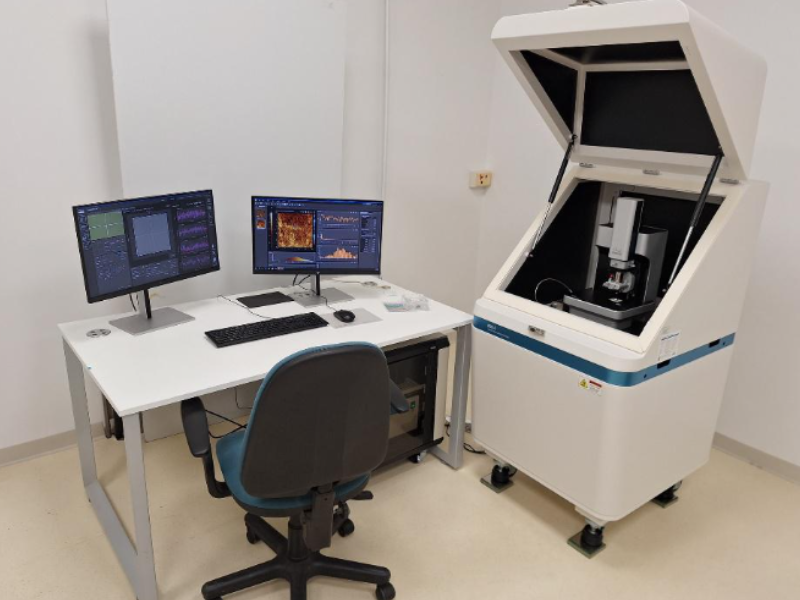
Atomic Force Microscope system.
Surface topography and local properties such as electrostatic-, electric-, magnetic- and mechanical properties can be studied through the Atomic Force Microscope NX10 Park System Co., present at ICMATE Padova.
Topography can be scanned in non-contact-, contact- and tapping mode, depending on the nature of the investigated material, and on the specific property to be mapped: these define the criteria for the selection of the probe.
Several AFM probes are available, with different tips materials and shapes, cantilever stiffnesses, resonance frequencies and Q-factors.
The platform supports research and characterization in surface properties and morphology across multiple length scales.
Our Configuration

Max sample size: 100×100 mm, 20 mm thickness.
Scan range: XY: 50×50 µm, Z: 15 µm.
Conductive AFM: Electrical gain range with VECA amplifier (10pA – 10mA).
Key Application Areas
Our instrument can perform:
Electrostatic Force Microscopy (EFM): for a qualitative mapping of the surface charge/electrostatic potential distribution.
Kelvin Probe Microscopy (KPFM): for quantitative measurement of the surface potential and work function.
Conductive AFM (C-AFM): to measure the current flow at the tip-sample contact point, detecting conductive domains.
Magnetic Force Microscopy (MFM): for magnetic domains detection.
Lateral Force Microscopy (LFM): measuring cantilever twisting from the friction between the tip and the sample.
Force-Distance spectroscopy (FD): for stiffness, modulus, deformation, adhesion, energy dissipation evaluation.
Measurements & Data
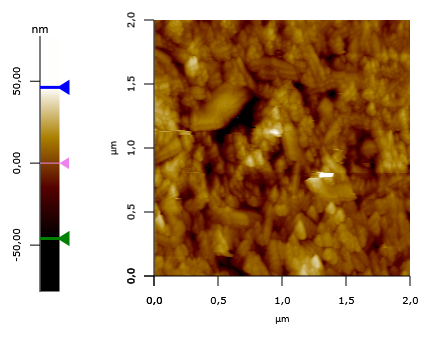
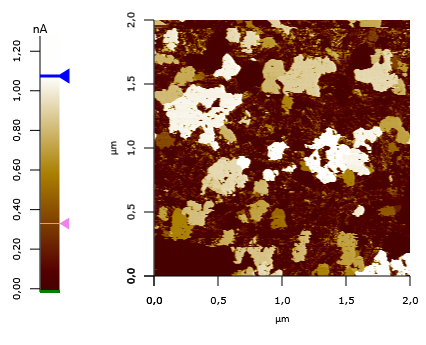
Two micrographs acquired on the same area of a surface: the contrast of the left image is due to the morphology of the sample, measured as Z-height profiles, while the contrast of the right-one is due to the measured current, highlighting domains with different electrical conductivity.
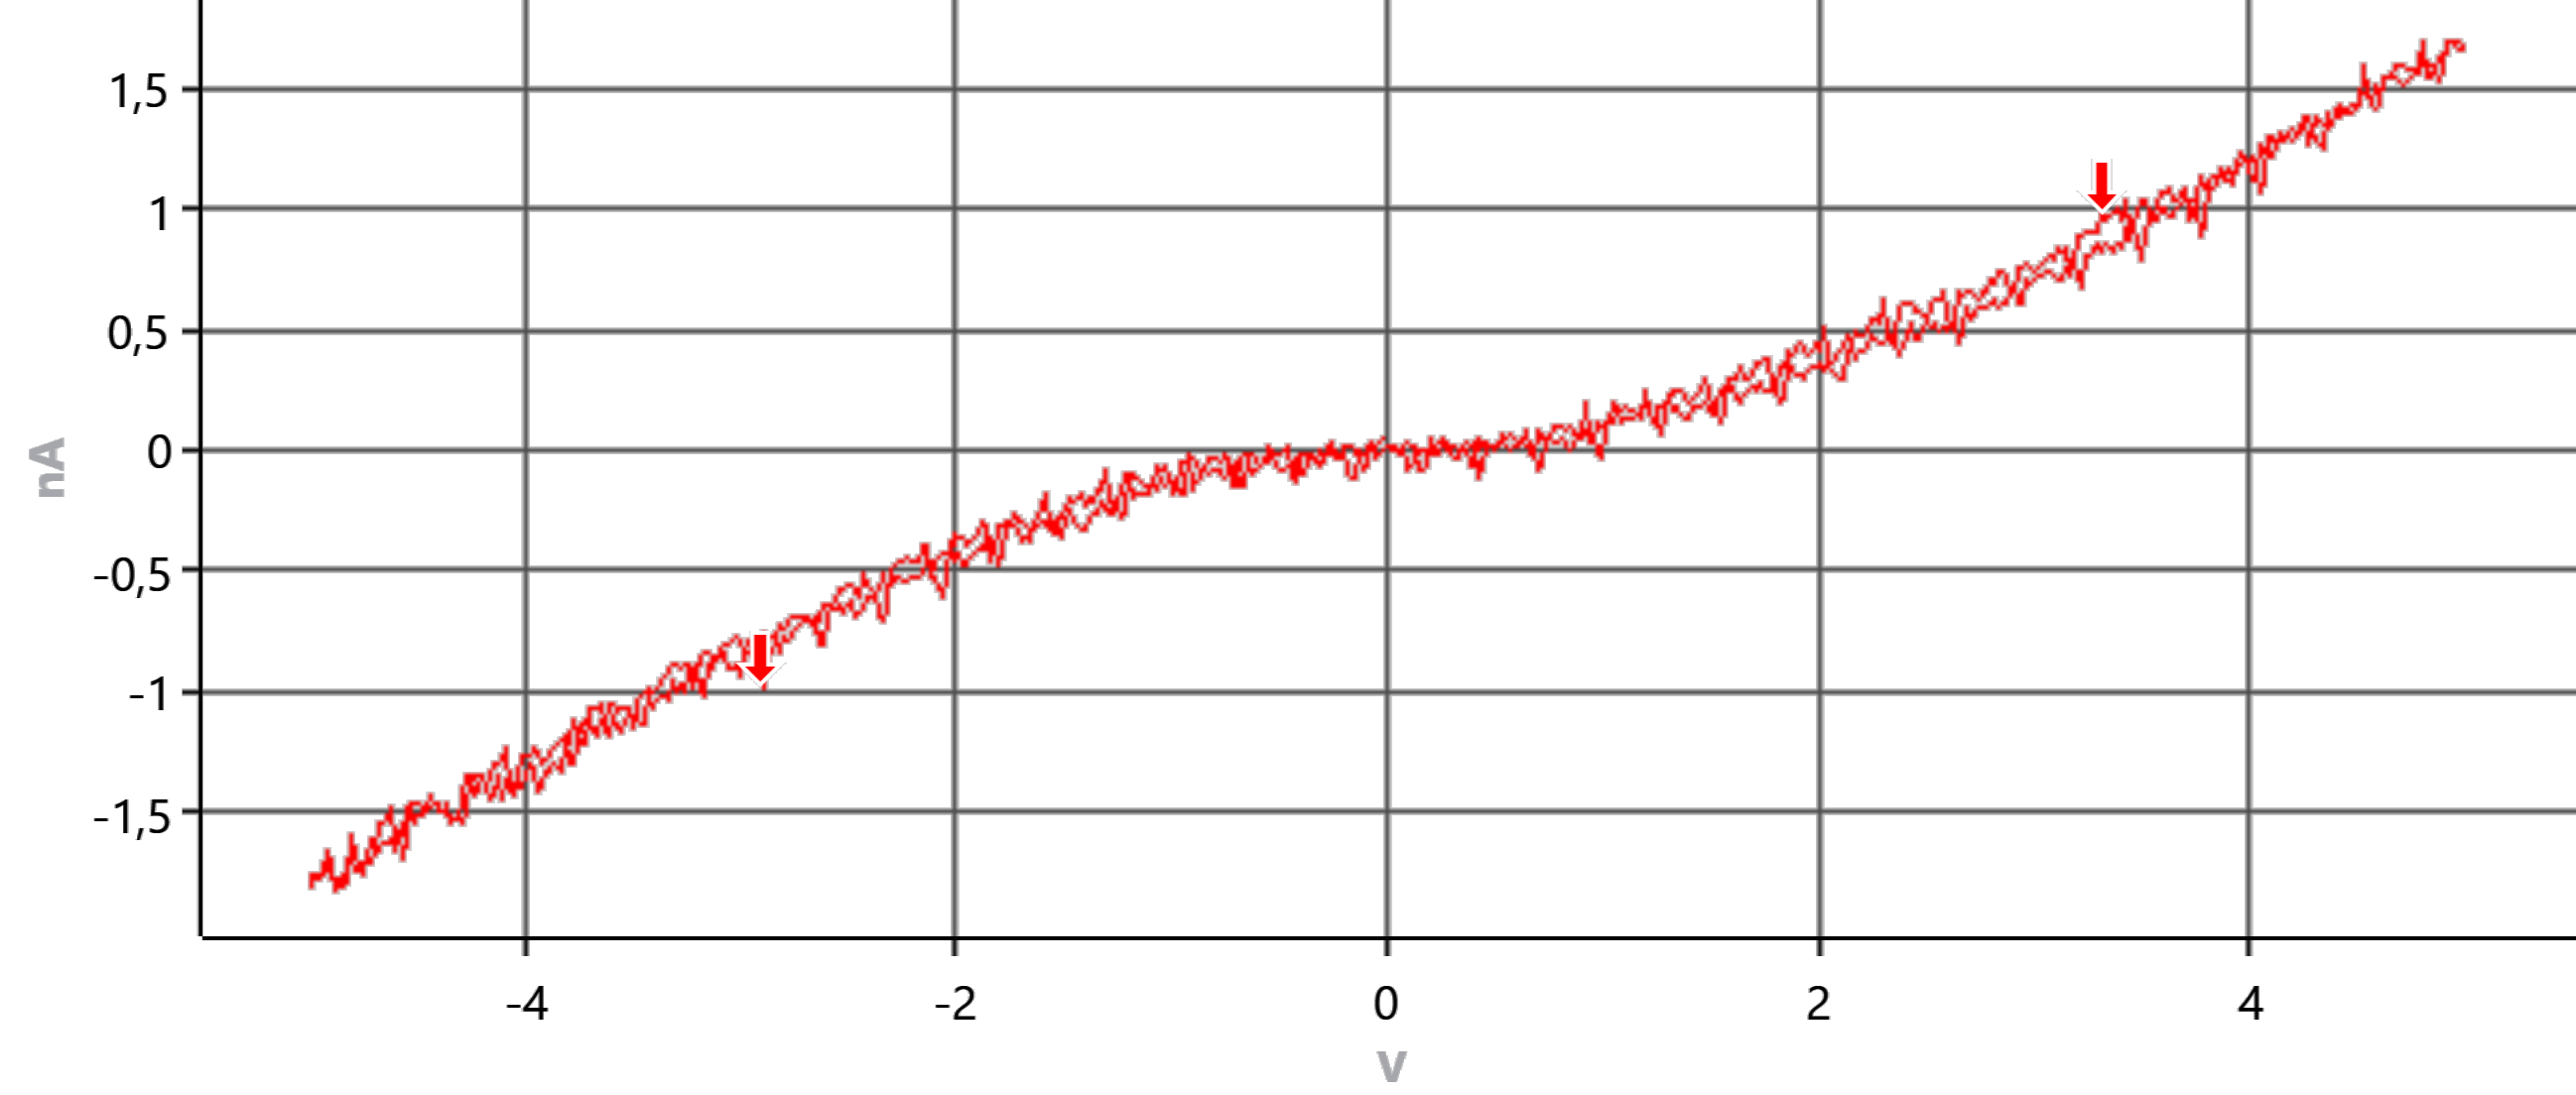
Current-Voltage (I-V) curve measured on a selected point (marked as a green star) of the sample surface.
Atomic force microscope (AFM) NX10 Park System Corporation
Padua
Surface topography and local properties such as electrostatic-, electric-, magnetic- and mechanical properties can be studied through the Atomic Force Microscope NX10 Park System Co., present at ICMATE Padova.
Topography can be scanned in non-contact-, contact- and tapping mode, depending on the nature of the investigated material, and on the specific property to be mapped: these define the criteria for the selection of the probe.
Several AFM probes are available, with different tips materials and shapes, cantilever stiffnesses, resonance frequencies and Q-factors. Our instrument can perform:
Electrostatic Force Microscopy (EFM), for a qualitative mapping of the surface charge/electrostatic potential distribution
Kelvin Probe Microscopy (KPFM) for quantitative measurement of the surface potential and work function
Conductive AFM (C-AFM) to measure the current flow at the tip-sample contact point, detecting conductive domains
Magnetic Force Microscopy (MFM) for magnetic domains detection
Lateral Force Microscopy (LFM), measuring cantilever twisting from the friction between the tip and the sample
Force-Distance spectroscopy (FD), for stiffness, modulus, deformation, adhesion, energy dissipation evaluation
OUR INSTRUMENT
Max sample size: 100×100 mm
20mm thickness
scan range XY: 50×50 µm, Z: 15 µm.
Conductive AFM electrical gain range with VECA amplifier (10pA – 10mA).
Two micrographs acquired on the same area of a surface: the contrast of the left image is due to the morphology of the sample, measured as Z-height profiles, while the contrast of the right-one is due to the measured current, highlighting domains with different electrical conductivity.
The current-voltage (I-V) curve measured on a selected point (marked as a green star) of the sample surface.
CONTACT
For further information, please contact